
Bet on what the numbers say.
Not what you feel.
Every metric, in plain English. Know exactly why a line moves — before it moves.
Last 10-15-20 min stats
Shots, attacks, corners and cards in the most recent 10, 15 or 20 minutes. Shows what's happening right now — not the whole match average.
Pressure Index
A 0-80 score that measures real attacking intensity — shots, dangerous attacks, territory, momentum — updated every minute during the match.
xG (Expected Goals)
The quality of chances a team creates. 1.0 xG = one goal's worth of chances. Better than shot count — it measures how dangerous each chance actually is.
Fair Odds
What the odds should be based on xG and simulations — without bookmaker margin. Compare to market odds: the bigger the gap, the bigger your edge.
ML Metrics
146 machine-learning metrics per fixture across 120+ leagues. Attack power, defense power, corner models, card models, momentum deltas — all computed automatically.
Smart Money
When sharp bettors or prediction markets back a side. Follow the money that moves the line — before the retail market reacts.
How dangerous is each team, really?
Attack Power (AP) and Defense Power (DP) compare a team to the league average. 1.00 = average. Above 1 for attack = more dangerous. Below 1 for defense = tighter at the back. Simple.
How to read it: City creates 59% more goal chances than average at home (1.59) and concedes 42% fewer (0.58). Palace is slightly below average going forward (0.94) but solid defensively (0.87). City should dominate — the numbers say goals are likely, and Palace probably won't outscore them.
How to read it: City wins corners very often (1.42) and rarely concedes them (0.71). Palace barely wins corners away (0.88) and concedes frequently (1.15). This screams Over corners — City will force plenty, Palace won't.
How to read it: City is very disciplined (0.72) and calm (0.69) — few cards. Palace is poor (1.18) and aggressive (1.22) — they collect yellows. If you're betting cards, Palace is the side to back for bookings.
This is what you get
Not a mockup. The actual Football Pro board — the same view our traders use every matchday.
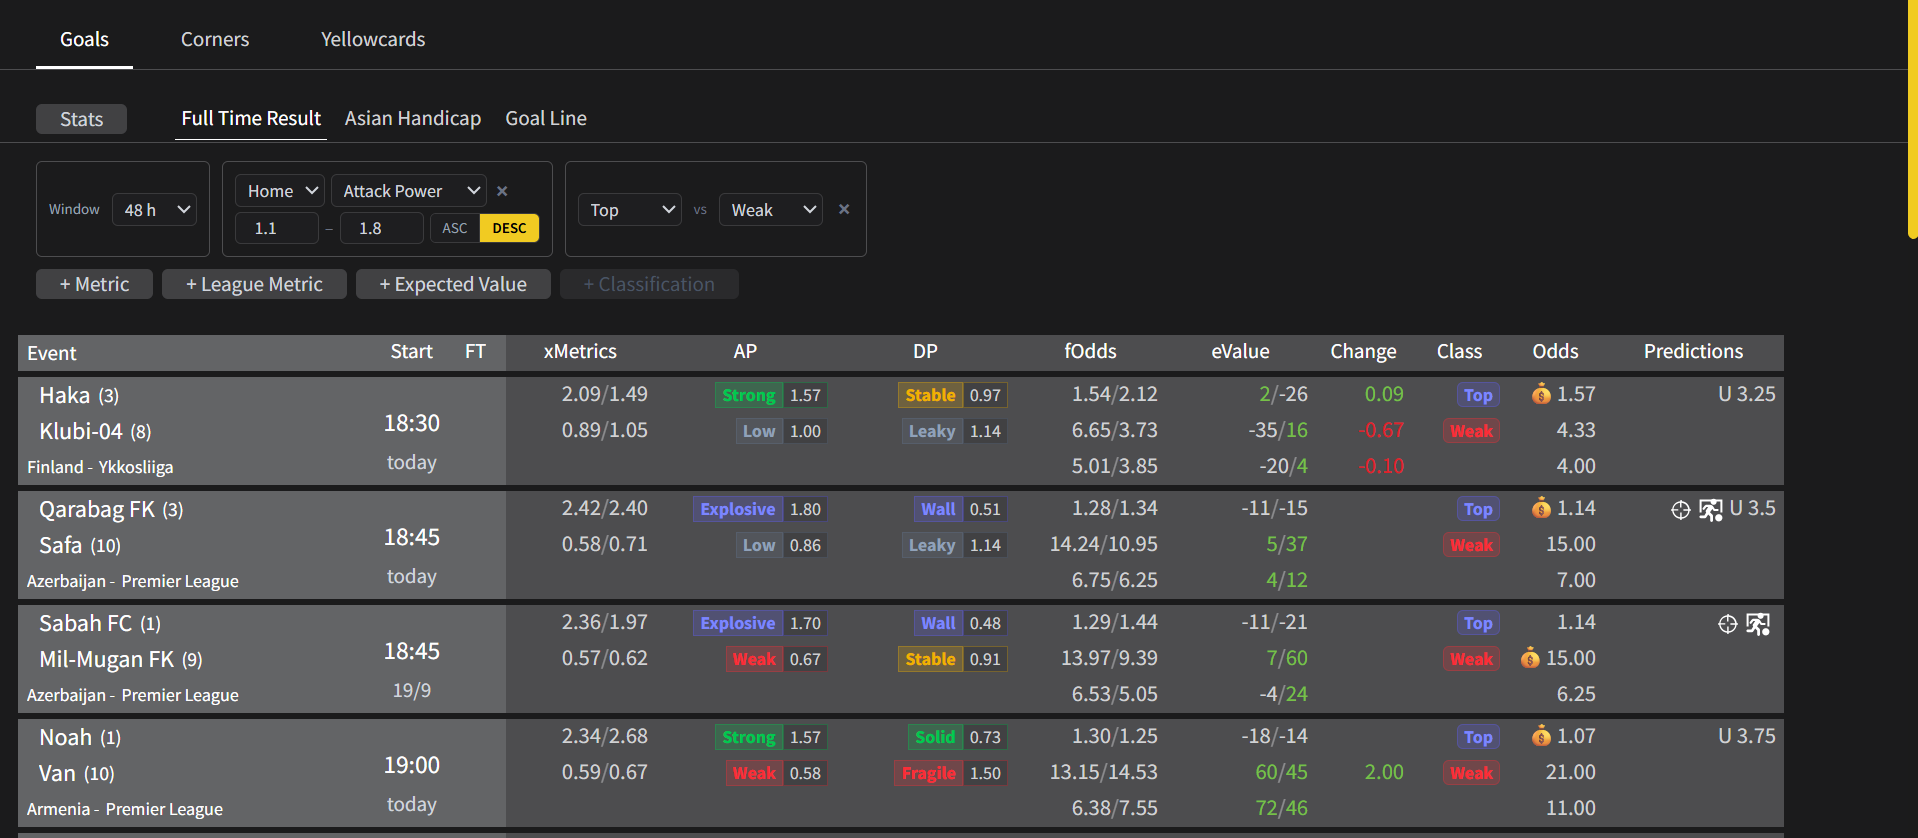
Every fixture, every metric, one screen
Attack & defense power, fair odds, expected value, odds movement and smart-money flags — all in one row. The 💰 marks where sharp money has landed.
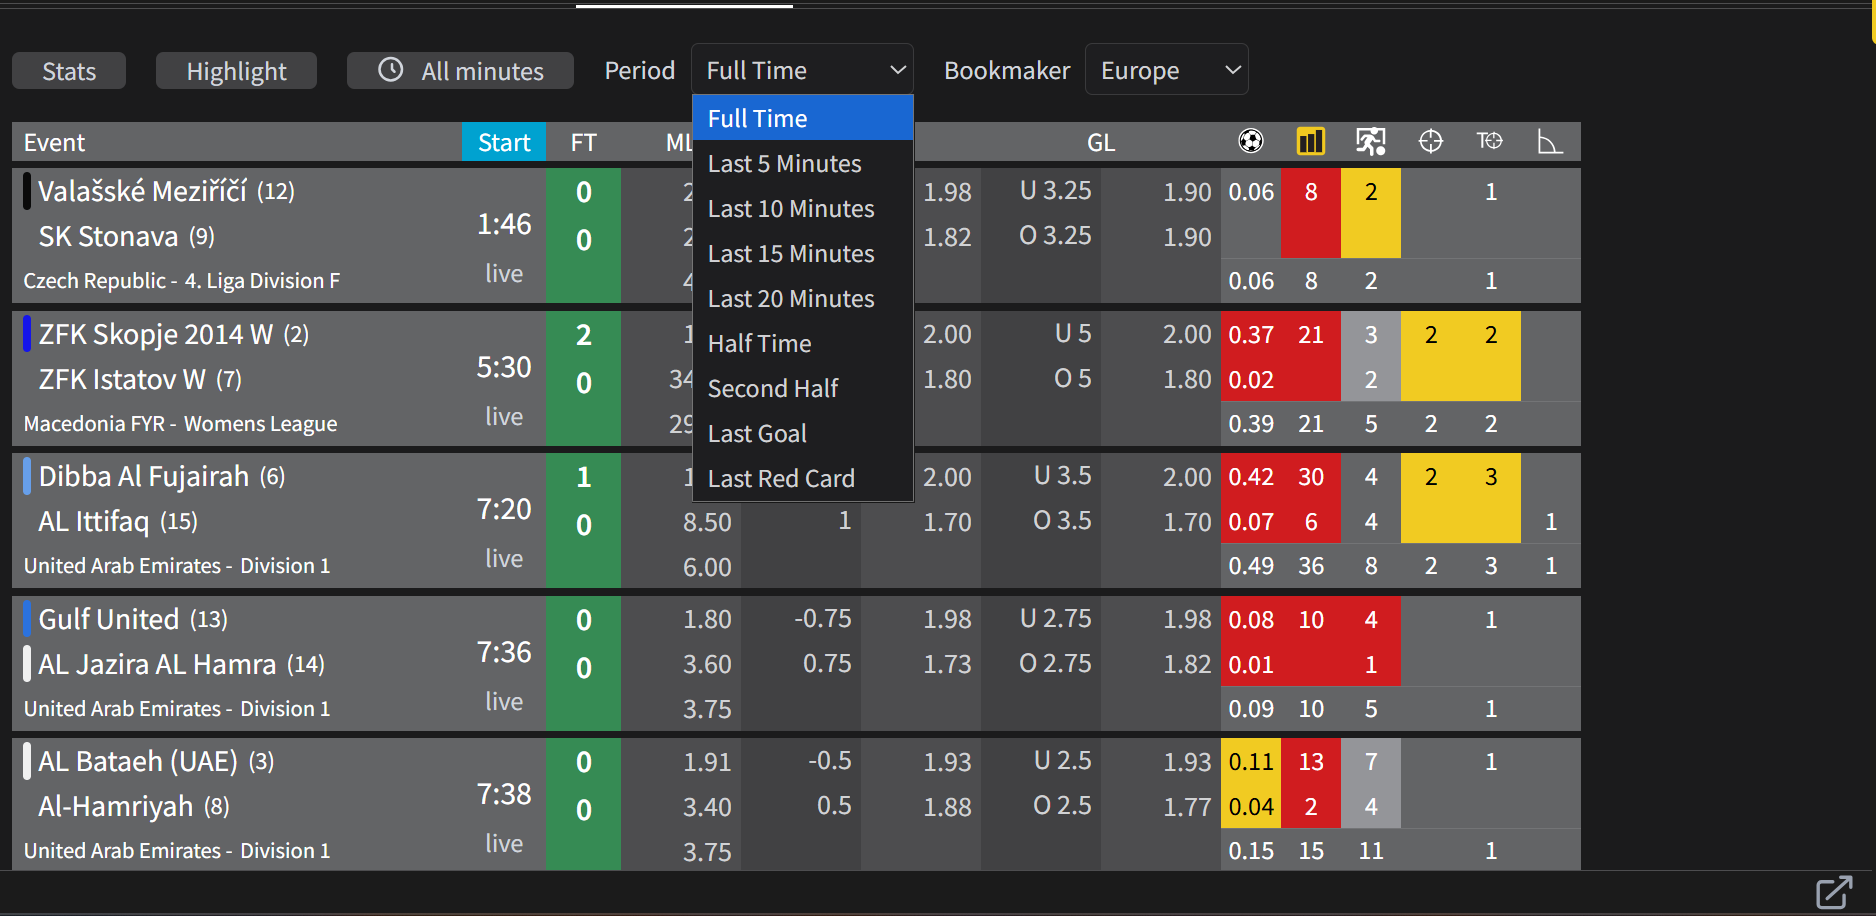
Slice any match by the last 5, 10, 15 or 20 minutes
Switch the period and the whole board re-sorts. Last-10-min shots, attacks, corners and cards — so you read momentum, not just the scoreline.
See it all in action
Every metric, every match, every minute — live on Football Pro.